
Soil bulk density (SBD)
The trend in soil bulk density (SBD) over the two growing seasons is consistent (Fig. 2). In 2022, the use of slow-release fertilizer (SRF) significantly decreased soil SBD compared to both compound fertilizer (NPK) and bio-microbial fertilizer (BM), with the N2 level proving most beneficial for topsoil structure when using SRF. In 2023, at the N1 level, the type of fertilizer had no significant effect on soil SBD. However, at the N2 level, both BM and SRF significantly reduced SBD, and there was no difference in SBD reduction between the SRF treatments at the N2 and N3 levels.
Effects of different nitrogen application levels and fertilizer types on Soil bulk density (SBD) of quinoa. The error bars for each treatment represent the standard error of the mean (n = 3). Different lowercase letters indicate significant differences between different treatments (P < 0.05).
Soil water content (SWC)
Heading stage
During the heading stage of quinoa, the interaction among soil depth, nitrogen (N) level, and fertilizer type significantly affected soil SWC (P < 0.01). From 2022 to 2023, the SWC in the 0–1 m soil layer initially increased and then decreased with increasing soil depth, typically peaking around the 60 cm soil layer. In 2022, there were no significant differences among the fertilizer treatments across the three N application levels, and the trend remained consistent for all treatments (Fig. 3a). In 2023, after the application of BM and SRF, the overall SWC in soil layers deeper than 60 cm remained between 16% and 18% (Fig. 4a).
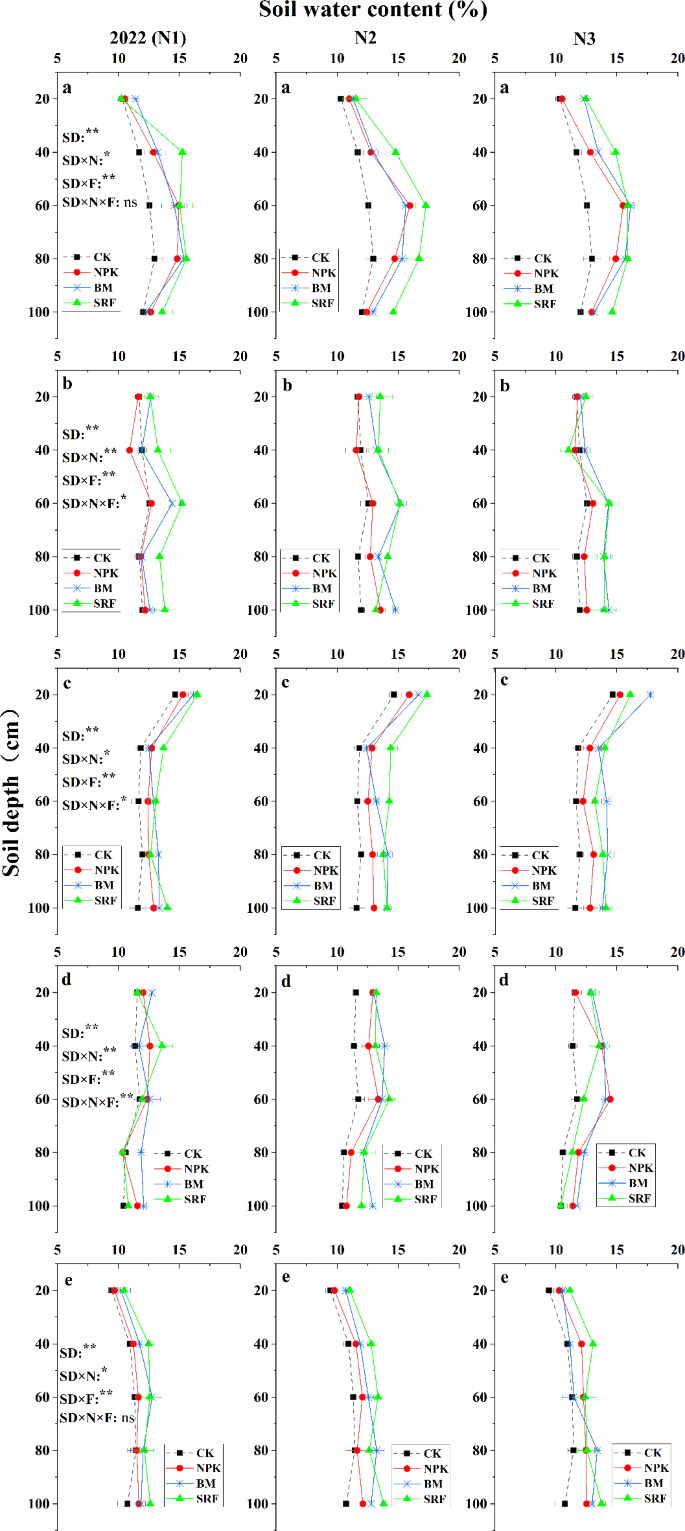
The effects of different nitrogen application levels and fertilizer types on the vertical distribution characteristics of soil moisture content in quinoa soil were investigated at various growth stages in 2022. The error bars associated with each process represent the standard error of the mean (n = 3). Heading stage (A), Anthesis stage (B), Pre-grouting stage (C), Post-grouting stage (D), Maturity stage (E). In the three-factor analysis of variance, SD, SD × N, SD × F, and SD × N × F represent the effects of soil depth, soil depth × nitrogen level, soil depth × fertilizer type, and the interaction between soil depth, nitrogen level, and fertilizer type on soil moisture content, respectively. * indicate significance at the 0.05 level, ** indicate significance at the 0.01 level, and ‘ns’ indicates non-significance.
Anthesis stage
During the anthesis period, the interaction between soil depth, N level, and fertilizer type in 2022 significantly influenced SWC (P ≤ 0.01) (Fig. 3b). As soil depth increased, soil SWC initially increased and then decreased. The SRF treatment demonstrated high water use efficiency. In 2023, the interaction of these three factors significantly impacted soil SWC (P ≤ 0.01) (Fig. 4b). As soil depth increased, soil SWC exhibited a decreasing trend. Furthermore, there were significant differences in soil SWC among the various fertilizer types, particularly at the N2 level.
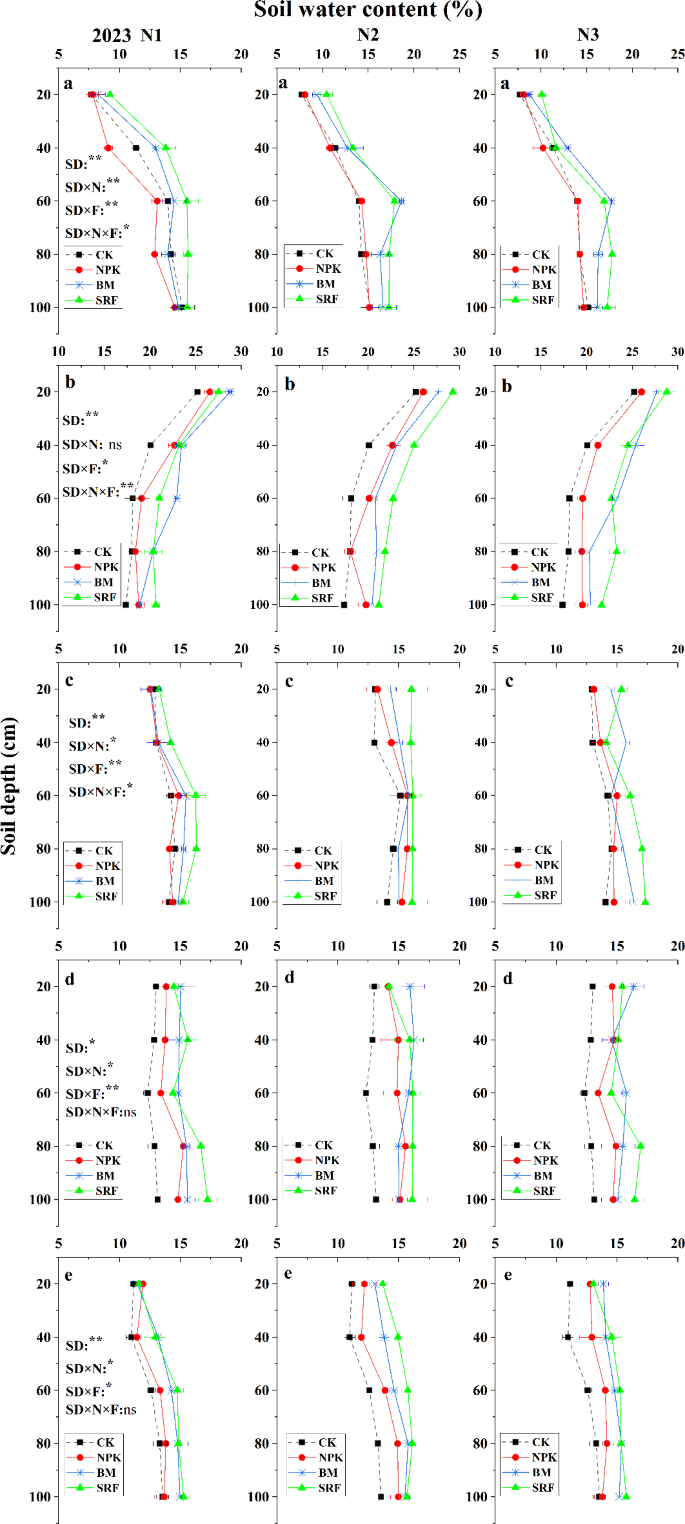
The effects of different nitrogen application levels and fertilizer types on the vertical distribution characteristics of soil moisture content in quinoa soil were investigated at various growth stages in 2023. The error bars associated with each process represent the standard error of the mean (n = 3). Heading stage (A), Anthesis stage (B), Pre-grouting stage (C), Post-grouting stage (D), Maturity stage (E). In the three-factor analysis of variance, SD, SD × N, SD × F, and SD × N × F represent the effects of soil depth, soil depth × nitrogen level, soil depth × fertilizer type, and the interaction between soil depth, nitrogen level, and fertilizer type on soil moisture content, respectively. * indicate significance at the 0.05 level, ** indicate significance at the 0.01 level, and ‘ns’ indicates non-significance.
Pre-grouting stage
Before grouting, the combined interaction of soil depth, N level, and fertilizer type significantly affected soil SWC (0.05 < P ≤ 0.01) (Fig. 3c and 4c). In 2022, soil SWC exhibited a decreasing trend as soil layers increased, with no significant differences in SWC among the three N levels. SWC remained stable at approximately 13% in soil layers exceeding 40 cm (Fig. 3c). In 2023, SWC showed a trend of initially increasing and then decreasing with increasing soil depth. Notably, SRF significantly enhanced the infiltration of SWC into deeper soil layers, maintaining SWC at 17% in soil layers below 60 cm for both the N2 and N3 application levels (Fig. 4c).
Post- grouting stage
After grouting, the interaction among soil depth, N level, and fertilizer type was highly significant (P ≤ 0.01) (Fig. 3d and 4d). The overall change in soil SWC across the two growing seasons was insignificant. Specifically, in 2022, the vertical distribution of soil SWC showed an initial increase followed by a decrease, remaining within the range of 11–14%. In 2023, the SWC maintained levels between 14% and 16%.
Maturity stage
During the maturity period in 2022, the interaction between soil depth, N level, and fertilizer type was significant (P < 0.01) (Fig. 3e). As soil layers increased, the soil SWC exhibited an upward trend. At the N1 level, the soil SWC of the NPK treatment was comparable to that of the control group (CK) across all soil layers. However, at the N2 and N3 levels, the soil SWC of the NPK treatment was significantly enhanced. Both BM and SRF reached their highest SWC at the N2 level, with no significant difference between them. Soil SWC below the 20 cm depth was maintained at 12–13%. In 2023, the interaction between soil depth, N level, and fertilizer type remained significant (P < 0.01) (Fig. 4e). The SWC of BM and SRF increased with rising soil layers. Compared to N1, both N2 and N3 N levels significantly elevated the soil SWC of BM and SRF, maintaining an overall range of 13–15%.
Soil organic matter (SOM), alkali hydrolyzed N (AH-N), available P (AP) and available K (AK)
Fertilizer type and N level can significantly increase SOM content, and there are significant differences among different treatments at different stages (P ≤ 0.01) (Table S1). During the mature stage, the SOM content peaked, with increases ranging from 9.1 to 57.6% compared to the CK that did not receive any fertilization. Among the various fertilizer treatments, BM was particularly effective, significantly increasing the SOM content to its highest level at the N3 application level (Fig. 5).
The type of fertilizer, N level, and their interaction with the growth period all have a significant impact on AH-N, AP, and AK (P < 0.05) (Table S1). Both BM and SRF have a significant promoting effect on soil N, phosphorus, and potassium nutrients (Fig. 5). The accumulation rate of AH-N nutrients is highest from the heading stage to the anthesis, while the growth rate of AP and AK is highest from the anthesis to the filling stage. The content of AH-N, AP, and AK all peaks during the filling stage and decreases as the N application level increases up to N3. Among all treatments, the BM treatment had the highest content of AH-N, AP, and AK in the mature stage those were 27.7%, 50%, and 44.1% higher than CK, respectively. At the N2 level, there was no significant difference between the SRF and BM treatments. It was worth noting that the AK content in the surface soil was particularly high at the N3 N application level, with the BM treatment reaching its peak at this level. The BM treatment results in an increase in AK content by 5.7–11% compared to other fertilizers.
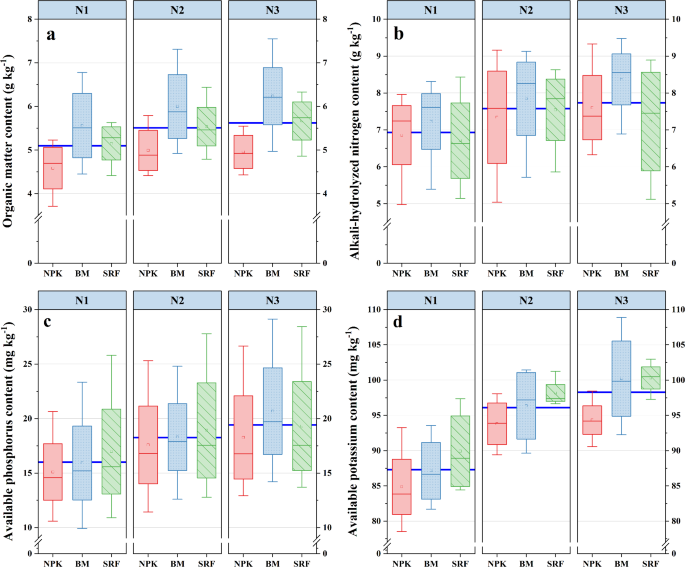
Effects of different nitrogen application levels and fertilizer types on soil organic matter (SOM-a), alkali-hydrolyzed N (AH-N-b), available P (AP-c), and available K (AK-d).
Soil urease (S-UE) and sucrase activity (S-SC)
Results reveled that fertilizer types and N application levels can significantly increase S-UE and S-SC activities (Fig. 6). Soil S-UE and S-SC activities of the BM treatment were significantly higher than those of CK and other fertilization treatments, the S-UE activity of the BM treatment was 28.3% and 10.3% higher than that of the NPK and SRF, respectively. As the N application level increased, the S-SC activity of the NPK and BM exhibited a trend of first increasing and then decreasing. When compared to CK, each fertilizer type increased S-SC activity by 48.3%, 79.5%, and 58.3% respectively. Therefore, the level of N application had little effect on the activity of S-UE and S-SC; the primary influence may be attributed to the selection of fertilizer types.
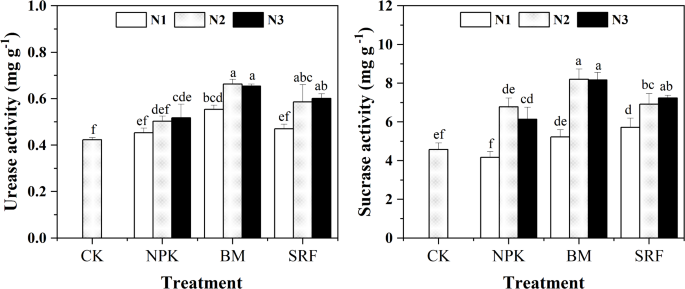
Effects of different nitrogen application levels and fertilizer types on Soil Urease (S-UE), Sucrase activity (S-SC) of quinoa. The error bars for each treatment represent the standard error of the mean (n = 3). Different letters on the bars indicate statistical significance following Duncan’s multiple range test (P < 0.05). Different lowercase letters indicate significant differences between different treatments (P < 0.05).
Plant height, leaf area (LA), above-ground biomass and yield components
N level and the type of fertilizer have a significant influence on the plant height of mature quinoa (P < 0.05), which first increases and then decreases with the increase of N application level. The highest effect is achieved in the SRF treatment, which is 16.7% higher than the CK (Table 2).
The LA and above-ground biomass of mature quinoa increase with the increase of N application level, and the effects of N application level, fertilizer type, and their interactions are significant (P < 0.05). The response of LA to the BM treatment was the most pronounced, achieving the highest level at N3, which was 4.5–15.1% greater than that observed under other fertilization treatments. Above-ground biomass of mature quinoa initially increased and then decreased as N application levels rose, with the except of the NPK treatment, which continued to increase with higher N levels. Compared to the CK treatment, NPK, BM, and SRF increased above-ground biomass by 83.4%, 69.1%, and 101.9%, respectively (Table 2). N level, fertilizer type, and their interaction have a highly significant effect on the branch number and main spike length of quinoa (P ≤ 0.01). All treatments significantly increased the branch number and main ear length of quinoa. At the N2 level, the branch number reached its highest level for all three fertilizer types. Similarly, at the N2 level, the main spike length of the BM and SRF treatments peaked.
Grain yield and water use efficiency (WUE)
N level, fertilizer type, and their interaction have a significant impact on the yield of quinoa (P ≤ 0.01) (Table 3). NPK treatment showed an increase with the rise in N application level, and increased by 65.2% and 68.8% respectively, compared to CK, for two consecutive years. BM and SRF treatments displayed a trend of initially increasing and then decreasing with the increase in N application level. For two consecutive years, SRF treatment yielded the highest in N2, outperforming both NPK and BM treatments by 15.6% and 10.5% (2022), 11.2% and 8.8% (2023). Compared to the N2 and N3 levels, the yield of quinoa at the N1 level decreased by 23–38.4% in 2022 and by 29.9–45.3% in 2023.
N level, fertilizer type, and their interaction exhibit a significant influence on WUE (P ≤ 0.01) (Table 3). In 2023 WUE of each fertilizer increased by an average of 18.4% (NPK), 16% (BM), and 14.2% (SRF) compared to previous year. Notably, SRF demonstrated a substantial boost in WUE, achieving increases of 16.2% and 10.8% in 2022, and 12.1% and 9.2% in 2023, relative to NPK and BM treatments, respectively. Furthermore, the WUE at N2 and N3 N levels surpassed that at the N1 level.
Economic benefit of quinoa
Different fertilizer types and N levels exhibited significant variations in the economic benefits of quinoa production (Table 4). In the absence of fertilization, after deducting other costs and a seed cost of 3,500 yuan (CNY) per hectare, the economic benefit per hectare amounted to 35,514.6 CNY. When considering the costs of fertilizer, seeds, and other expenses, BM and SRF were found to be most economical at the N2 N level, whereas NPK was most economical at the N3 level. Fertilization significantly enhanced economic benefits, SRF yielded economic benefits that were 7,434 CNY and 9,040 CNY higher than those of NPK and BM, respectively. Overall, the highest economic benefits for SRF were observed at the N2 N level.
Principle component analysis (PCA) of soil moisture and nutrients
The effects of varying nitrogen application levels on soil moisture and nutrient content exhibited distinct differences. Upon conducting dimensionality reduction analysis (Fig. 7a), it was observed that there were minimal differences between N1 and CK, whereas N2 and N3 exhibited similar trends. The disparities among the treatments were statistically significant. Regarding individual indices (Fig. 7b), soil bulk density and water consumption displayed negative correlations with other indicators. Soil water storage showed a negative correlation with the moisture content of the 60 cm soil layer, whereas other indicators demonstrated significant positive correlations. All types of fertilizers significantly enhanced soil nutrient levels (Fig. 8). However, the effects varied among different fertilizer treatments. Specifically, the BM treatment had a more pronounced effect on overall soil nutrient levels, while SRF notably increased soil urease activity and available potassium content. Additionally, NPK fertilizer significantly increased the soil alkali-hydrolyzed nitrogen content.
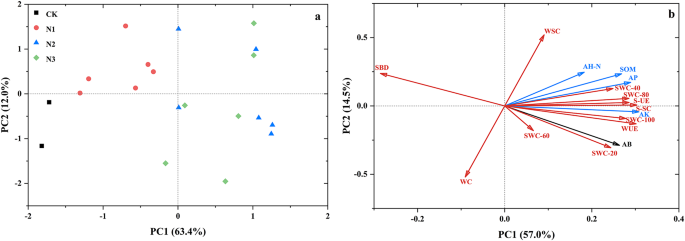
PCA analysis of soil nutrient and water related indicators under different nitrogen application levels and fertilizer types. S-UE, Soil urease; S-SC, Soil sucrase; SOM, Organic matter; AH-N, Alkaline hydrolysis nitrogen; AP, Available phosphorus; AK, Available potassium; MC-20, 0–20 cm moisture content; MC-40, 20–40 cm moisture content; MC-60, 40–60 cm moisture content; MC-80, 60–80 cm moisture content, MC-100, 100 cm moisture content; WSC, Mature water storage capacity; WC, Water consumption; WUE, Water use efficiency.
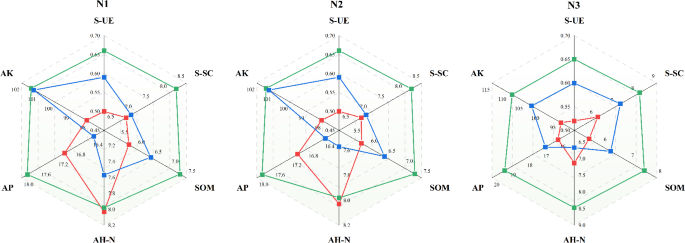
Effects of different nitrogen application levels and fertilizer types on soil nutrients.
Path analysis of soil moisture and nutrients and yield
To clarify the direct effects of different fertilizer types and nitrogen application levels on quinoa yield, path analysis was conducted for each index and yield (Table 5). According to the correlation coefficients, soil available potassium and sucrase activity had the highest correlation with yield, reaching 0.888 and 0.846, respectively. The highest direct path coefficient was for available potassium, indicating its importance as an index affecting quinoa yield. Additionally, the indirect path coefficient showed that available phosphorus can significantly increase quinoa yield through the action of available potassium.


